Why is Excel no longer sufficient for analyzing your restaurant sales?
Noémie Daniel
Updated on:
26 February 2026
Share this article
Analyzing a restaurant's revenue is no longer limited to filling out a table at the end of the month. Multiple channels, schedule variations, material costs, and team management make management more complex and strategic.
Sales analysis software connected to your cash register automates reporting, centralizes data, and transforms figures into concrete decisions. Here's how to modernize your management and improve performance.
Why is Excel no longer sufficient for analyzing your restaurant sales?
Excel remains an accessible tool, but it quickly shows its limitations in an environment as dynamic as the restaurant industry. However, managing a restaurant requires real-time visibility. You need to understand immediately why your average basket size is falling on a Tuesday evening, why a product is performing better for delivery than in the dining room, or why your margin is declining in a particular category.
Restaurant management software connected to your cash register automatically centralizes data and generates reliable reports without manual processing. You save time and make more confident decisions.
A good dashboard is not limited to overall revenue. It highlights the restaurant performance indicators that are truly useful on a daily basis.
1. Sales per hour, day, and period
Analyzing restaurant revenue by time slot allows you to adjust staff schedules and optimize production. You can identify peak periods, slow periods, and seasonal variations. This allows you to adjust your inventory and payroll accordingly.
2. Average ticket and average basket
How do you calculate the average ticket price for a restaurant? Simply divide the turnover by the number of tickets. But the interest lies not in the calculation, but in the analysis. Which products increase the average basket size? Which channels bring it down?
Analytics software highlights these variations and helps you implement concrete actions.
Analyzing a restaurant's revenue without looking at the margin is incomplete. An analysis tool identifies high-performing products, those that need improvement, and those that should be removed. You can optimize your menu and refine your menu engineering strategy.
“Thanks to the analyses, I can easily adjust my gross margin, do my accounting, my statistics, and adjust my payroll.” Anthony Lloret - Ankka franchisee.
4. Sales performance by channel (dine-in, takeout, delivery)
In-store, click & collect, or delivery: each channel has its own profitability logic. Connected analytics software allows you to compare revenue, average basket size, and margin by channel in real time.
With an AI solution such as Atlas, developed by Innovorder, abnormal discrepancies are detected automatically. You can quickly identify imbalances and adjust your strategy without waiting until the end of the month.
5. Customer return rate and visit frequency
An effective restaurant dashboard also tracks customer recurrence. You measure the impact of your marketing actions and detect weak signals before they become problematic.
How does analytics software transform restaurant management?
The difference between Excel and restaurant sales analysis software lies in the ability to transform data into action.
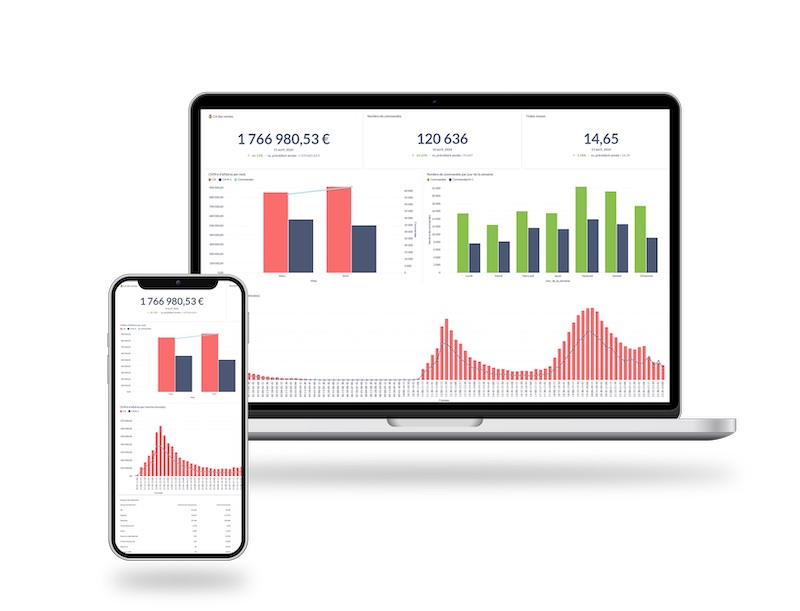
Automatic reporting and visual dashboards
The software retrieves cash register data in real time and displays it in clear dashboards. You can immediately view your activity, without exporting or reprocessing.
Real-time alerts on performance deviations
An unusual drop in a specific time slot? A decrease in the average basket size? A product that is underperforming? The tool automatically detects these anomalies.
Comparing week to week or year to year becomes instantaneous. You anticipate variations rather than suffer them.
Profitability analysis per dish and menu engineering
The analytics software cross-references sales, volumes, and margins to identify star products, high-margin products, and low-contribution products. This allows you to make decisions based on data, not intuition.
Time savings and data-driven decisions
The difference lies not only in accuracy, but also in speed. Where Excel requires hours of processing, connected software provides real-time indicators.
With Innovorder Atlas, key data is accessible in seconds, allowing you to immediately adjust your decisions based on facts, not intuition.
Which software should you choose to automate your sales analysis?
Selection criteria: integration, simplicity, and reliability
Good software should integrate seamlessly with your cash register and digital channels to avoid re-entering data. It should be simple enough to become a daily reflex and reliable enough to guarantee data accuracy.
Secure cloud architecture and centralized information are essential for smooth management, both at the point of sale and across the entire network.
Return on investment and support
Investing in an analytics tool must have a measurable impact on profitability. Optimizing margins, improving average basket size, reducing errors, and saving administrative time are the primary drivers.
Analyzing your revenue with Excel is now a thing of the past. In an industry where responsiveness makes all the difference, you need a tool that is fast, reliable, and action-oriented.
By adopting connected analytics software and an innovative solution such as Innovorder's Atlas, you can manage your business with precision, save time, and make better decisions faster.
"With 20 years' experience working for some of the world's largest foodservice groups, I'm helping the sector with its digital transformation through innovative digital solutions."
"With solid experience in developing key accounts, I'm supporting the digital transformation of the foodservice sector by proposing innovative digital solutions to optimize operations."